介绍
Even though we have added a basic test coverage in the previous steps, it seems like we accidentally broke our app, because it does not display prices to our invoices anymore. We need to debug the issue and fix it before someone finds out.
1.练习效果

2.源码
You can view and download all files at Walkthrough – Step 30.
|
1 2 3 4 5 6 7 8 9 10 11 12 13 14 15 16 17 18 19 20 21 22 23 24 25 26 27 28 29 30 31 32 33 34 35 36 37 38 39 40 41 42 43 44 |
<mvc:View controllerName="sap.ui.demo.walkthrough.controller.InvoiceList" xmlns="sap.m" xmlns:mvc="sap.ui.core.mvc"> <List id="invoiceList" class="sapUiResponsiveMargin" width="auto" items="{ path : 'invoice>/Invoices', sorter : { path : 'ShipperName', group : true } }"> <headerToolbar> <Toolbar> <Title text="{i18n>invoiceListTitle}"/> <ToolbarSpacer/> <SearchField width="50%" search=".onFilterInvoices"/> </Toolbar> </headerToolbar> <items> <ObjectListItem title="{invoice>Quantity} x {invoice>ProductName}" number="{ parts: [{path: 'invoice>ExTendedPrice'}, {path: 'view>/currency'}], type: 'sap.ui.model.type.Currency', formatOptions: { showMeasure: false } }" numberUnit="{view>/currency}" numberState="{= ${invoice>ExtendedPrice} > 50 ? 'Error' : 'Success' }"> <attributes> <ObjectAttribute text="{ path: 'invoice>Status', formatter: '.formatter.statusText' }"/> </attributes> </ObjectListItem> </items> </List> </mvc:View> |
We introduced a typo in the binding of the number attribute to simulate a frequent
error; instead of using ‘invoice>ExtendedPrice’ we use
‘invoice>ExTendedPrice’. Now we
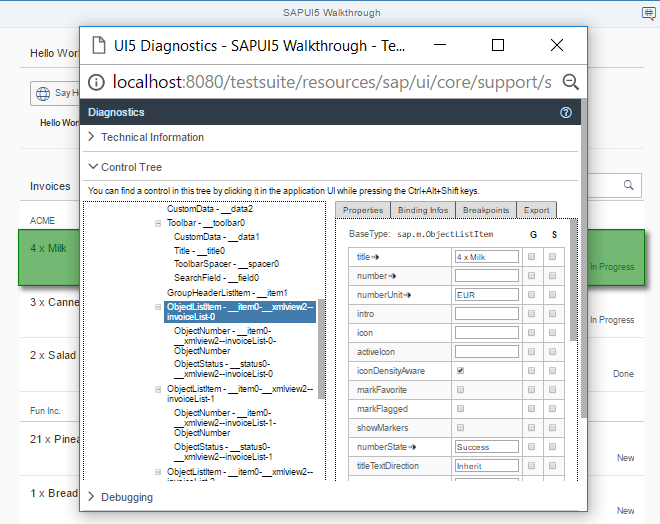
call the app and notice that the price is actually missing. By pressing
CTRL
+ ALT
+ SHIFT
+ S
we open the SAPUI5 support
diagnostics tool and check the app.
3.Note
If you use the Google Chrome browser, you can install the UI5 Inspector plugin. With this plugin, you can easily debug your SAPUI5- or OpenUI5-based apps. For more information, see UI5 Inspector.
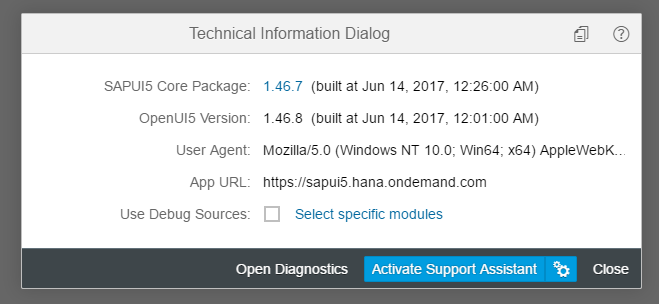
Besides technical information about the app and a trace that is similar to the
developer tools console of the browser, there is a really handy tool for checking
such errors in this dialog. Open the tab Control Tree by
clicking on the expand symbol on the right.
A hierarchical tree of SAPUI5 controls is
shown on the left and the properties of the selected control are displayed on the
right. If we now select the first ObjectListItem control of the
tree and go to the Binding Infos tab on the right, we can
actually see that the binding path of the number attribute is marked as invalid. We
can now correct the error in the view and the price should appear in the list of
invoices again.
Sometimes errors are not as easy to spot and you actually need to debug the
JavaScript code with the tools of the browser. For performance reasons, the SAPUI5 files are
shipped in a minified version, this means that all possible variable names are
shortened and comments are removed.
This makes debugging harder because the code is a lot less readable. You can load the
debug sources by adding the URL parameter sap-ui-debug=true or by
pressing
CTRL
+ ALT
+ SHIFT
+ P
and select Use Debug Sources in the dialog box that
is displayed. After reloading the page, you can see in the
Network tab of the browser’s developer tools that now a
lot of files with the –dbg suffix are loaded. These are the source
code files that include comments and the uncompressed code of the app and the SAPUI5 artifacts.

Technical information dialog
For a more detailed explanation of the SAPUI5 support tools,
go through the Troubleshooting tutorial.
If you’re stuck and need help for some development task, you can also post a question
in the SAPUI5-related
forums, for example in the SAP Community or on Stack Overflow.
4.Conventions
- As per SAPUI5
convention uncompressed source files end with *-dbg.js
