Chart Facet
Chart Facet
A chart facet is suitable to use if you wish to present data graphically for analysis.
To add a chart facet, use the UI.Facet term and include the UI.ReferenceFacet complex type, and then reference
the UI.Chart annotation. This is displayed as shown below within a content section of the object page:
Code Samples
The following code samples show an example of how to create your annotations for the chart facet:
UI.ReferenceFacet
<Annotations Target="STTA_PROD_MAN.STTA_C_MP_ProductType">
   <Annotation Term="UI.Facets">
      <Record Type="UI.ReferenceFacet">
         <PropertyValue Property="Label" String="{@i18n>@SalesData}"/>
         <PropertyValue Property="Target" AnnotationPath="to_ProductSalesData/@UI.Chart"/>
      </Record>
   </Annotation>
</Annotations>
UI.Chart
<Annotations Target="STTA_PROD_MAN.STTA_C_MP_ProductSalesDataType">
   <Annotation Term="UI.Chart">
      <Record>
         <PropertyValue Property="Title" String="Test Chart"/>
         <PropertyValue Property="ChartType" EnumMember="UI.ChartType/Column"/>
         <PropertyValue Property="Dimensions">
            <Collection>
               <PropertyPath>DeliveryMonth</PropertyPath>
            </Collection>
         </PropertyValue>
         <PropertyValue Property="Measures">
            <Collection>
               <PropertyPath>Revenue</PropertyPath>
            </Collection>
         </PropertyValue>
      </Record>
   </Annotation>
</Annotations>
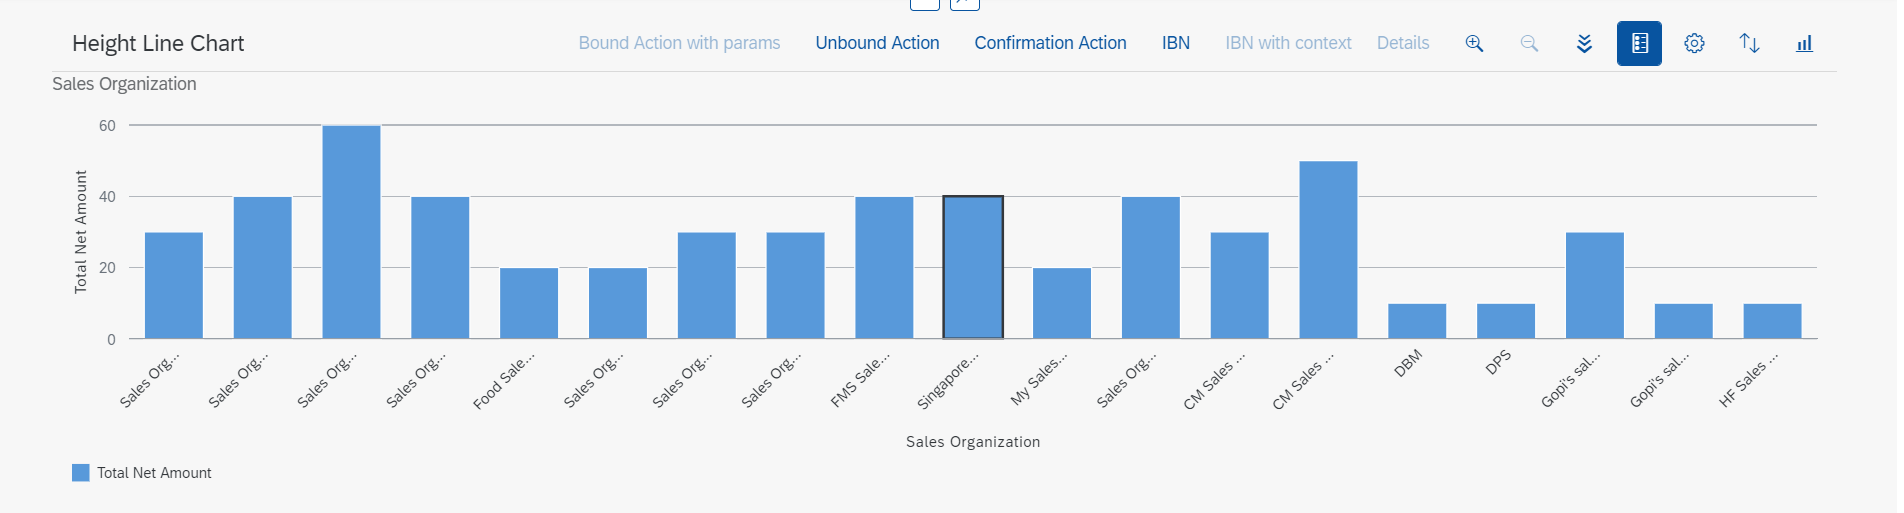
The chart definition contains measures, on which the aggregations calculations are done, and dimensions, which categorize these measures. In the chart, these are displayed as labels on the x and on the y axis.
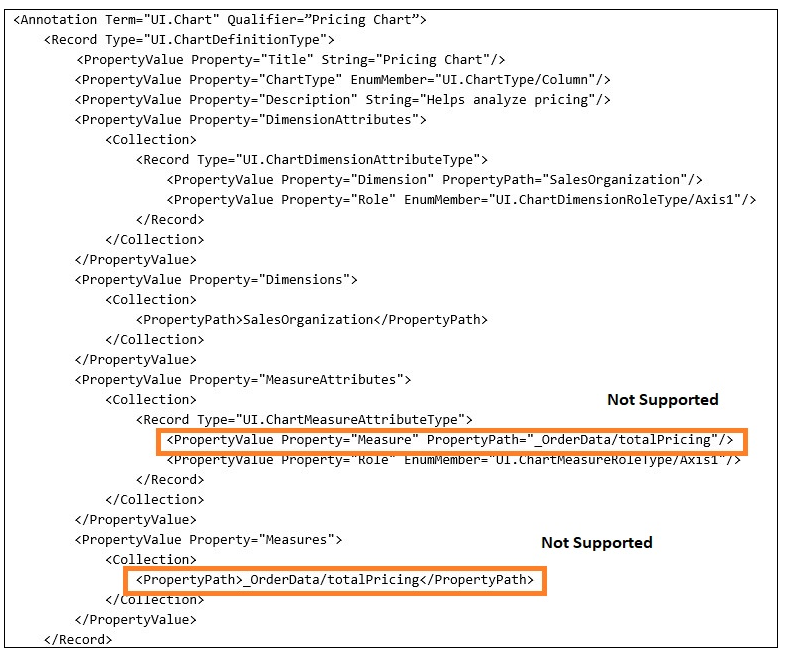
The use of navigation properties within the UI.Chart term is not supported (see example
below).
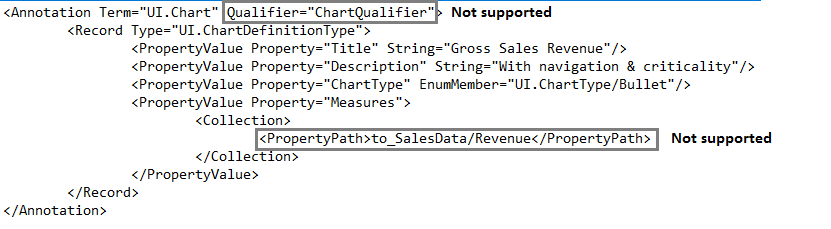
The object page does not support the UI.Chart with qualifier (see example below).
Enabling Charts in the Main Content Area
Application developers can add the UI.Chart as the first visualization to the
UI.PresentationVariant and point the AnnotationPath of the ReferenceFacet
to the UI.PresentationVariant.
<Record Type="UI.ReferenceFacet">
    <PropertyValue Property="Label" String="Items"/>
    <PropertyValue Property="ID" String="SalesOrderItems"/>
    <PropertyValue Property="Target" AnnotationPath="_Item/@UI.PresentationVariant"/>
    <Annotation Term="UI.Importance" EnumMember="UI.ImportanceType/High"/>
</Record>

<Annotation Term="UI.PresentationVariant">
    <Record Type="UI.PresentationVariantType">
        <PropertyValue Property="SortOrder">
            <Collection>
                <Record Type="Common.SortOrderType">
                    <PropertyValue Property="Property" PropertyPath="SalesOrderItem"/>
                    <PropertyValue Property="Descending" Bool="true"/>
                </Record>
            </Collection>
        </PropertyValue>
        <PropertyValue Property="Visualizations">
            <Collection>
                <AnnotationPath>@UI.LineItem</AnnotationPath>
                <AnnotationPath>@UI.Chart</AnnotationPath>
            </Collection>
        </PropertyValue>
    </Record>
</Annotation>
If a presentation variant has multiple visualizations, then only the first visualization is rendered.
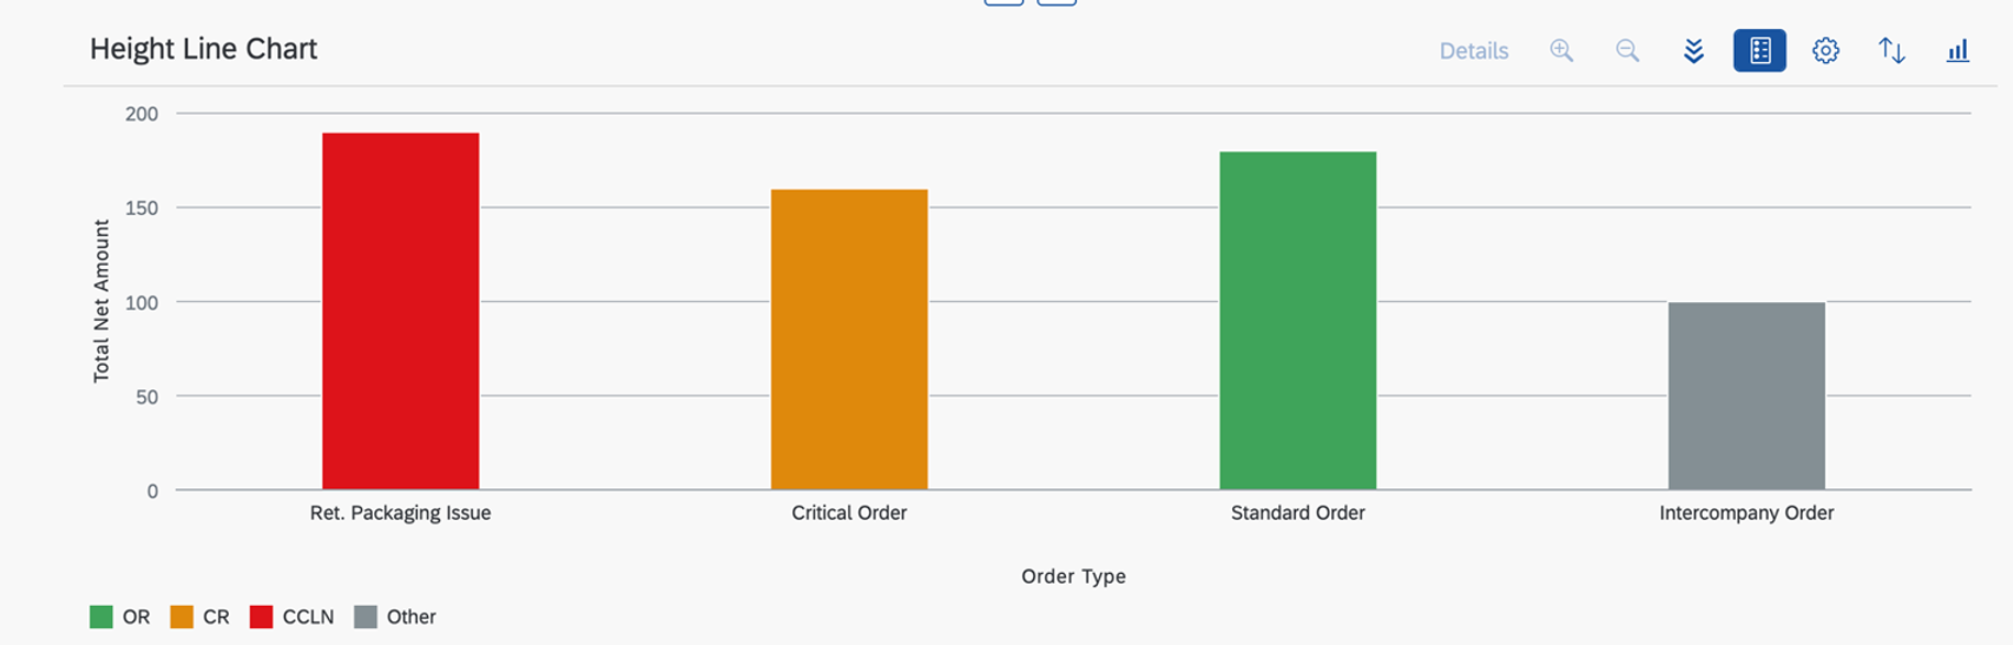
Support for Criticality Coloring
SAP Fiori elements currently supports the criticality based on UI.CriticalityType. This annotation has to be
wrapped with the UI.ValueCriticality, as shown below:
<Annotations Target="com.c_salesordermanage_sd_aggregate.SalesOrderManage/SalesOrderType">
    <Annotation Term="UI.ValueCriticality">
        <Collection>
            <Record Type="UI.ValueCriticalityType">
                <PropertyValue Property="Value" String="CCLN"/>
                <PropertyValue Property="Criticality" EnumMember="UI.CriticalityType/Negative"/>
            </Record>
            <Record Type="UI.ValueCriticalityType">
                <PropertyValue Property="Value" String="CR"/>
                <PropertyValue Property="Criticality" EnumMember="UI.CriticalityType/Critical"/>
            </Record>
            <Record Type="UI.ValueCriticalityType">
                <PropertyValue Property="Value" String="OR"/>
                <PropertyValue Property="Criticality" EnumMember="UI.CriticalityType/Positive"/>
            </Record>
        </Collection>
    </Annotation>
</Annotations>
This results in the following chart:
Enabling Aggregation in the Back End
For charts to work, the entity set must support aggregation. In the metadata, such entity sets have the
Aggregation.ApplySupported set and Aggregation.ApplySupportedType must be
Transformations. The Analytics.AggregatedProperties must then list all the aggregatable
measures/aggregation methods that are used.
Aggregation.ApplySupported (< SAP Cloud Application Programming Model-CDS Compiler 1.44.0)
<Annotations Target="com.c_salesordermanage_sd_aggregate.SalesOrderManage">
    <Annotation Term="Aggregation.ApplySupported">
        <Record Type="Aggregation.ApplySupportedType">
            <PropertyValue Property="Transformations">
                <Collection>
                    <String>aggregate</String>
                    <String>topcount</String>
                    <String>bottomcount</String>
                    <String>identity</String>
                    <String>concat</String>
                    <String>groupby</String>
                    <String>filter</String>
                    <String>expand</String>
                    <String>top</String>
                    <String>skip</String>
                    <String>orderby</String>
                    <String>search</String>
                </Collection>
            </PropertyValue>
        </Record>
    </Annotation>
    <Annotation Term="Analytics.AggregatedProperties">
        <Collection>
            <Record Type="Analytics.AggregatedPropertyType">
                <PropertyValue Property="Name" String="minPricing"/>
                <PropertyValue Property="AggregationMethod" String="min"/>
                <PropertyValue Property="AggregatableProperty" PropertyPath="NetPricing"/>
                <Annotation Term="Common.Label" String="Minimal Net Amount"/>
            </Record>
            <Record Type="Analytics.AggregatedPropertyType">
                <PropertyValue Property="Name" String="maxPricing"/>
                <PropertyValue Property="AggregationMethod" String="max"/>
                <PropertyValue Property="AggregatableProperty" PropertyPath="NetPricing"/>
                <Annotation Term="Common.Label" String="Maximal Net Amount"/>
            </Record>
            <Record Type="Analytics.AggregatedPropertyType">
                <PropertyValue Property="Name" String="avgPricing"/>
                <PropertyValue Property="AggregationMethod" String="average"/>
                <PropertyValue Property="AggregatableProperty" PropertyPath="NetPricing"/>
                <Annotation Term="Common.Label" String="Average Net Amount"/>
            </Record>
            <Record Type="Analytics.AggregatedPropertyType">
                <PropertyValue Property="Name" String="totalPricing"/>
                <PropertyValue Property="AggregationMethod" String="sum"/>
                <PropertyValue Property="AggregatableProperty" PropertyPath="NetPricing"/>
                <Annotation Term="Common.Label" String="Total Net Amount"/>
            </Record>
        </Collection>
    </Annotation>
</Annotations>Aggregation.ApplySupported (>= SAP Cloud Application Programming Model-CDS Compiler 1.44.0)
<Annotations Target="com.c_salesordermanage_sd_aggregate.EntityContainer/SalesOrderManage">
    <Annotation Term="Aggregation.ApplySupported">
        <Record Type="Aggregation.ApplySupportedType">
            <PropertyValue Property="Transformations">
                <Collection>
                    <String>aggregate</String>
                    <String>topcount</String>
                    <String>bottomcount</String>
                    <String>identity</String>
                    <String>concat</String>
                    <String>groupby</String>
                    <String>filter</String>
                    <String>expand</String>
                    <String>top</String>
                    <String>skip</String>
                    <String>orderby</String>
                    <String>search</String>
                </Collection>
            </PropertyValue>
        </Record>
    </Annotation>
    <Annotation Term="Analytics.AggregatedProperties">
        <Collection>
            <Record Type="Analytics.AggregatedPropertyType">
                <PropertyValue Property="Name" String="minPricing"/>
                <PropertyValue Property="AggregationMethod" String="min"/>
                <PropertyValue Property="AggregatableProperty" PropertyPath="NetPricing"/>
                <Annotation Term="Common.Label" String="Minimal Net Amount"/>
            </Record>
            <Record Type="Analytics.AggregatedPropertyType">
                <PropertyValue Property="Name" String="maxPricing"/>
                <PropertyValue Property="AggregationMethod" String="max"/>
                <PropertyValue Property="AggregatableProperty" PropertyPath="NetPricing"/>
                <Annotation Term="Common.Label" String="Maximal Net Amount"/>
            </Record>
            <Record Type="Analytics.AggregatedPropertyType">
                <PropertyValue Property="Name" String="avgPricing"/>
                <PropertyValue Property="AggregationMethod" String="average"/>
                <PropertyValue Property="AggregatableProperty" PropertyPath="NetPricing"/>
                <Annotation Term="Common.Label" String="Average Net Amount"/>
            </Record>
            <Record Type="Analytics.AggregatedPropertyType">
                <PropertyValue Property="Name" String="totalPricing"/>
                <PropertyValue Property="AggregationMethod" String="sum"/>
                <PropertyValue Property="AggregatableProperty" PropertyPath="NetPricing"/>
                <Annotation Term="Common.Label" String="Total Net Amount"/>
            </Record>
        </Collection>
    </Annotation>
</Annotations>
The properties specified within Analytics.AggregatableProperties are the ones that will be visible within the
chart personalization. A dimension is annotated as follows:
Dimension
<Annotations Target="com.c_salesordermanage_sd_aggregate.SalesOrderManage/SalesOrder">
    <Annotation Term="Aggregation.Groupable" Bool="true"/>
</Annotations>
A measure is annotated as follows:
Measure
<Annotations Target="com.c_salesordermanage_sd_aggregate.SalesOrderManage/NetPricing">
    <Annotation Term="Aggregation.Aggregatable" Bool="true"/>
</Annotations>
For the chart facet, the following applies:
-
Applications cannot control whether the chart selection can be configured to allow no selection or single selection. SAP Fiori elements always enables multi selection for the chart control.
-
If a table refresh occurs (because a user makes changes to the table personalization, for example), the chart is also refreshed to keep the chart and table data synchronized. Chart selections are not maintained, however, since they are not stored in the
iAppState. -
The app descriptor setting
initialLoad=falsedoes not affect the chart and table. Currently, both the chart and the table load data the application is launched.
Restrictions
The following restrictions apply regarding the support of the chart control:
-
Charts can be used only with entities that support aggregation. Currently, the entity set for which the chart annotation is configured cannot be a draft-enabled entity set – it has to be a read-only service.
-
SAP Fiori elements currently supports the transformation aggregates approach, not the custom aggregates approach.
-
Properties such as measures, dimensions, and text associations that come from associated entity sets are currently not supported.
-
Search is not supported when you are running the ALP flavor.
-
Chart personalization settings or selections are not part of the variant changes and are not saved in the
iAppState. -
The criticality via the
UI.CriticalityCalculationannotation is currently not supported. -
For SAP Cloud Application Programming Model CDS versions 3 or lower, the chart does not load properly if the parent entity set is non-aggregate based.